The home field advantage: How local markets actually watch football
By
Kailee Doherty
Marketing Manager
Published
October 20, 2026
Table of contents
Every fall, football draws the biggest audience on the TV calendar. But the national numbers only tell half the story. Madhive’s Maverick AI, our enterprise intelligence layer, measured a full season of household viewing across football, basketball, baseball, and soccer to see where that audience actually lives, when it shows up, and what it pays attention to. The answer: reach is national, but winning outcomes require a hyperlocal game plan.
Football is the biggest crowd on the calendar
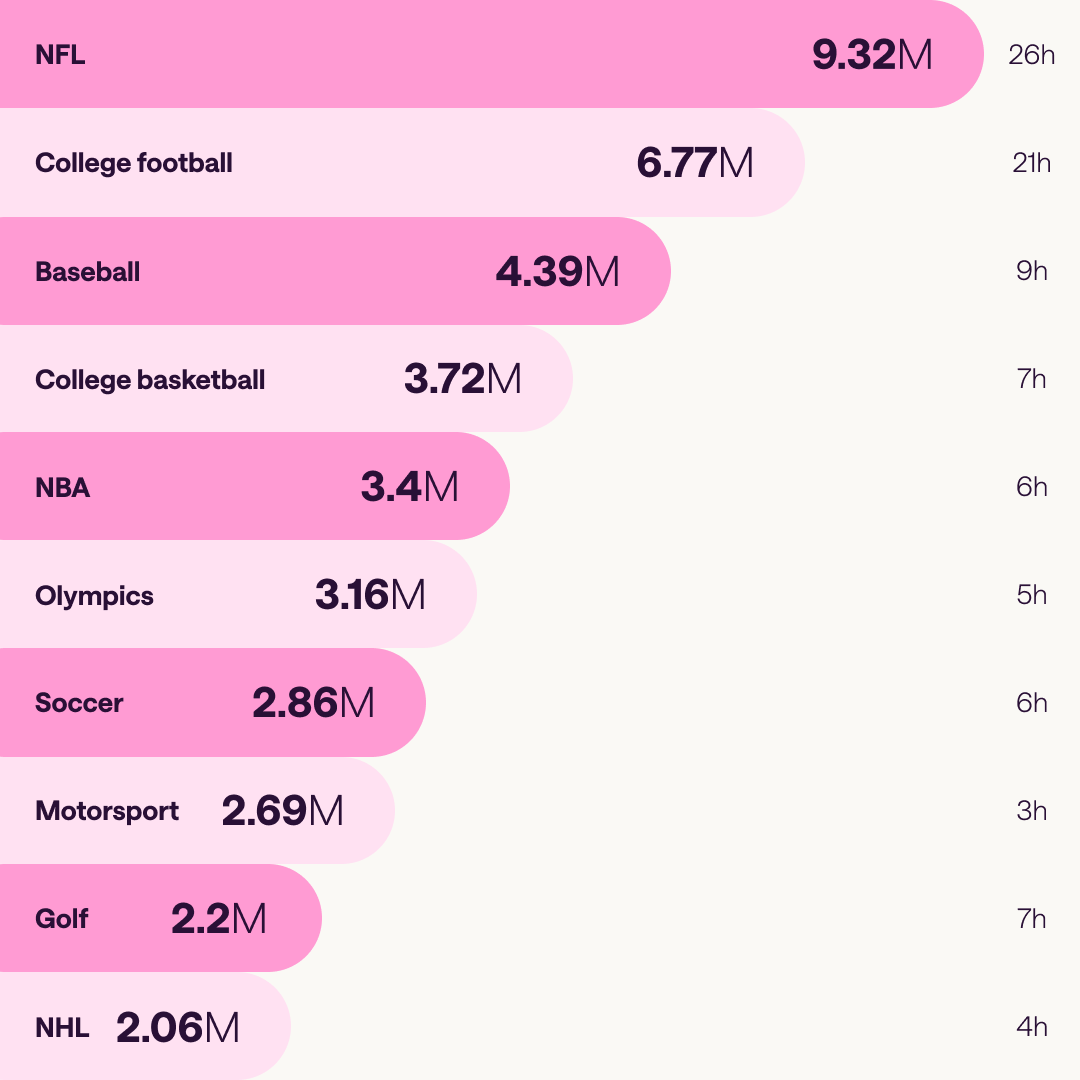
The NFL reached 9.32M households across the 2025 season, more than double college basketball or the NBA. Those households watched 26 hours each on average, nearly three times baseball, the most-watched sport by time outside football.
One crowd, three nights
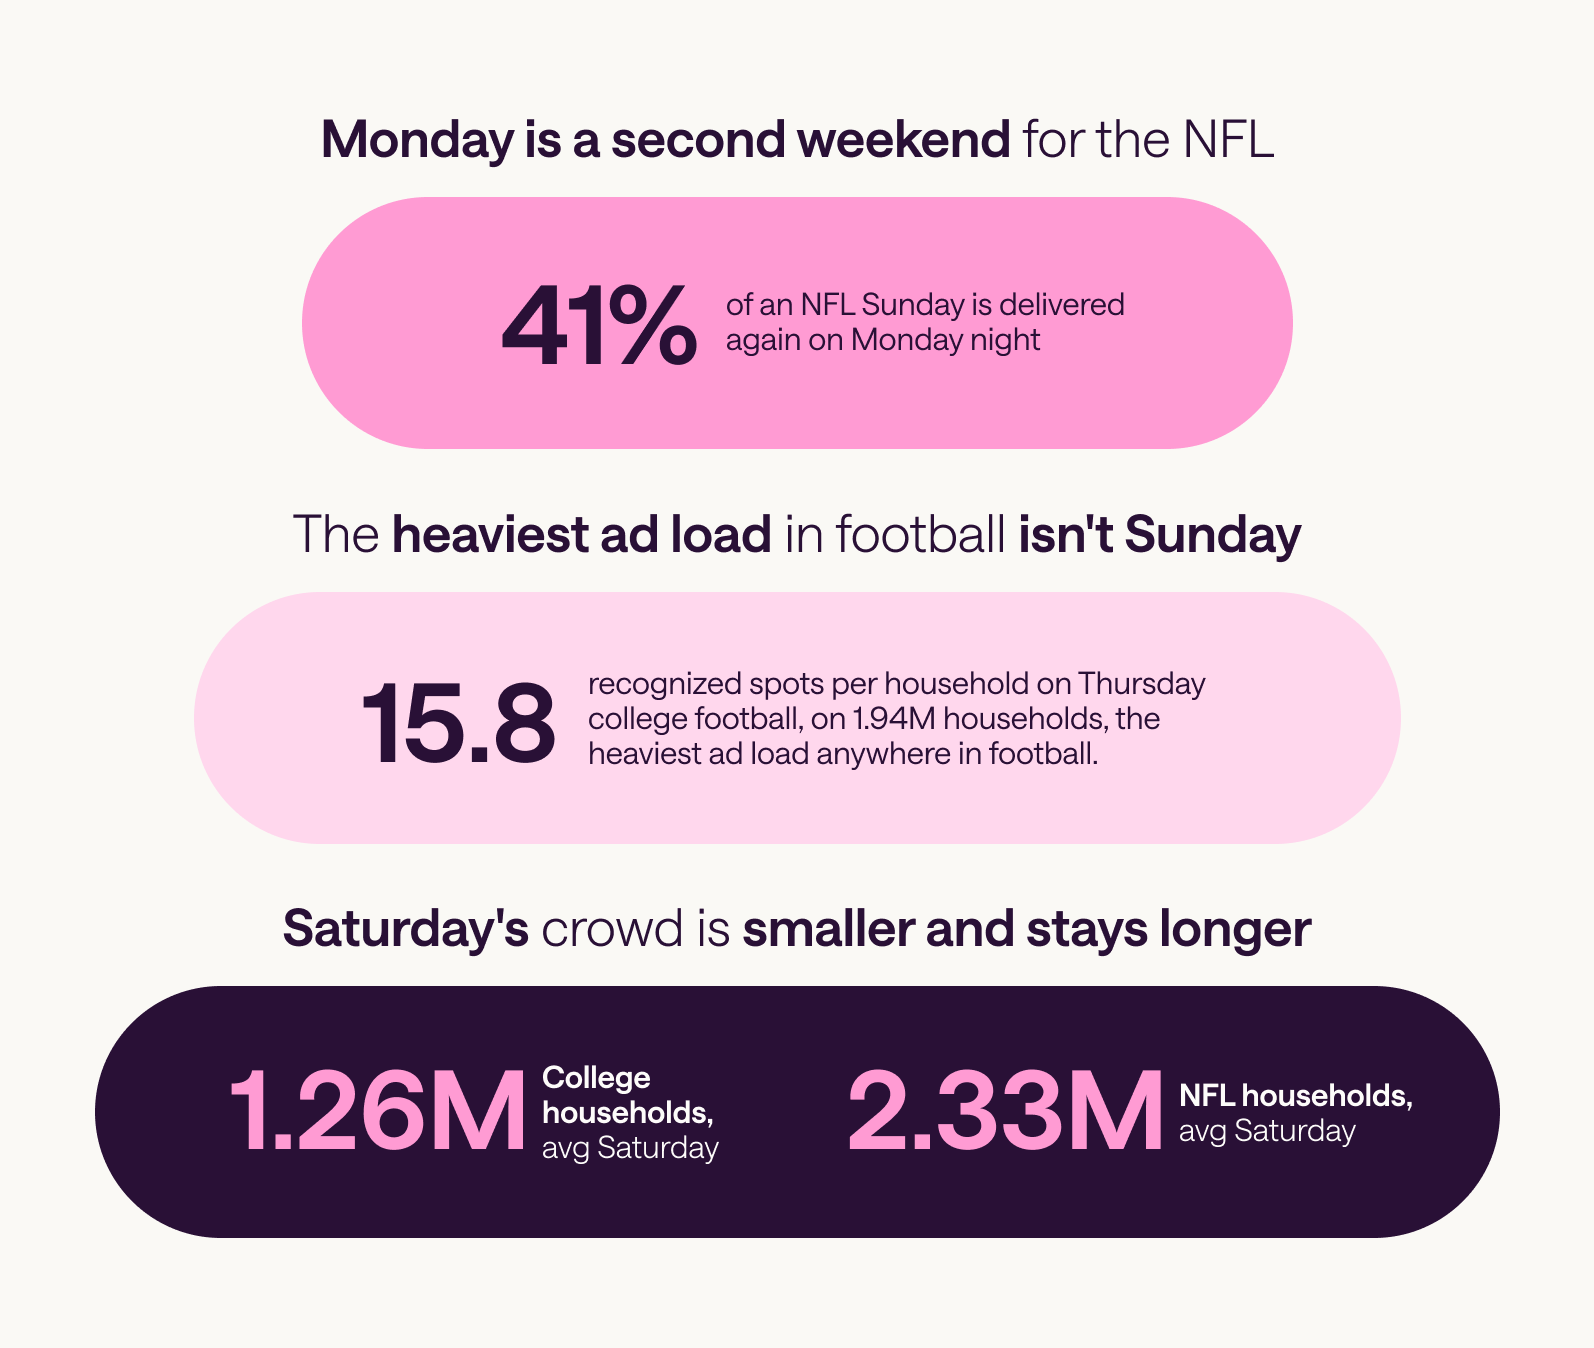
Weekend football reaches the same viewers repeatedly: 64.7% of Saturday college football households watch Sunday’s NFL games, and 41% return Monday night.
Football leads the shift to streaming
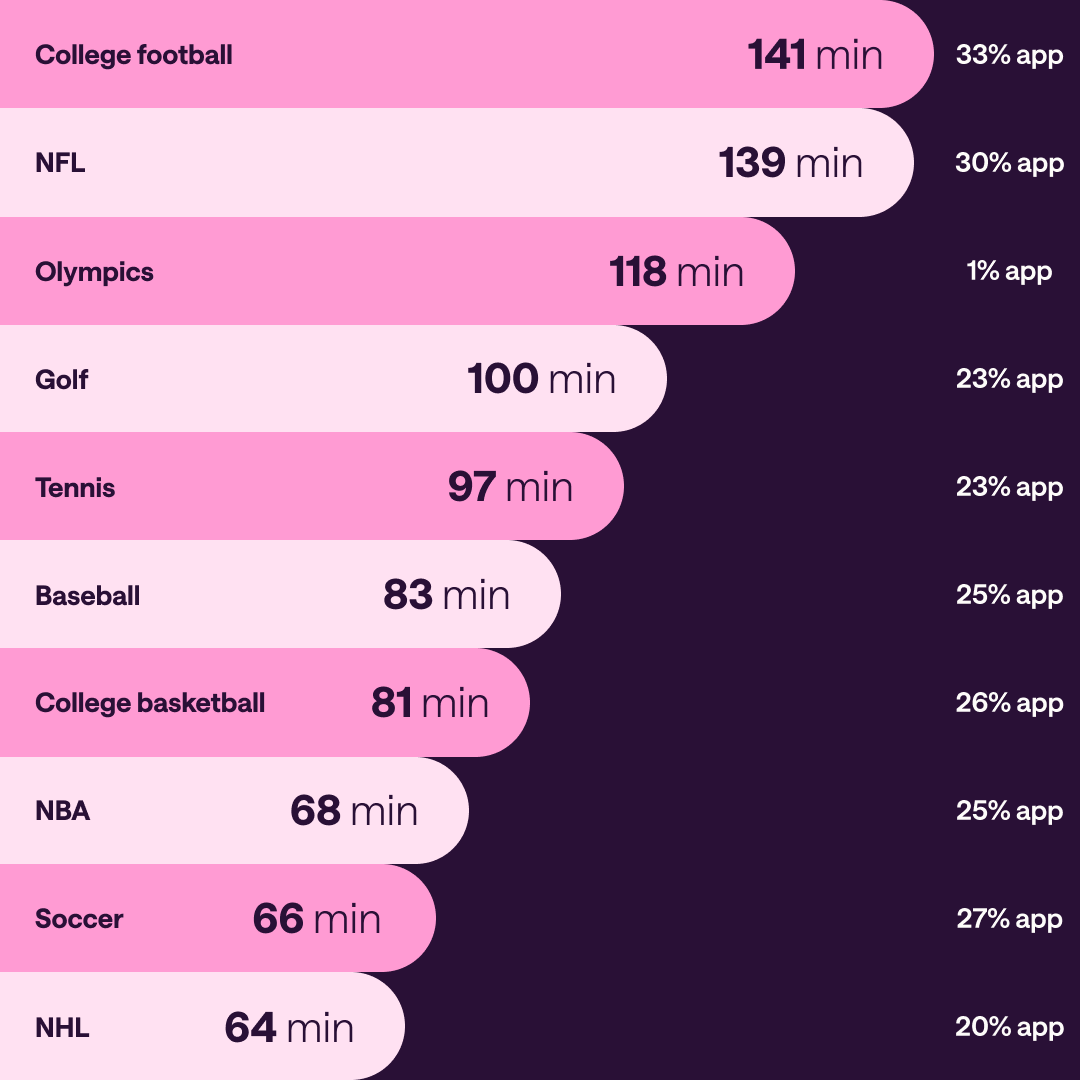
College football and the NFL lead all sports in viewing time, at 141 and 139 minutes. They also lean hardest on streaming: 33% of college football minutes are watched in apps, the highest share of any sport, followed by the NFL at 30%.
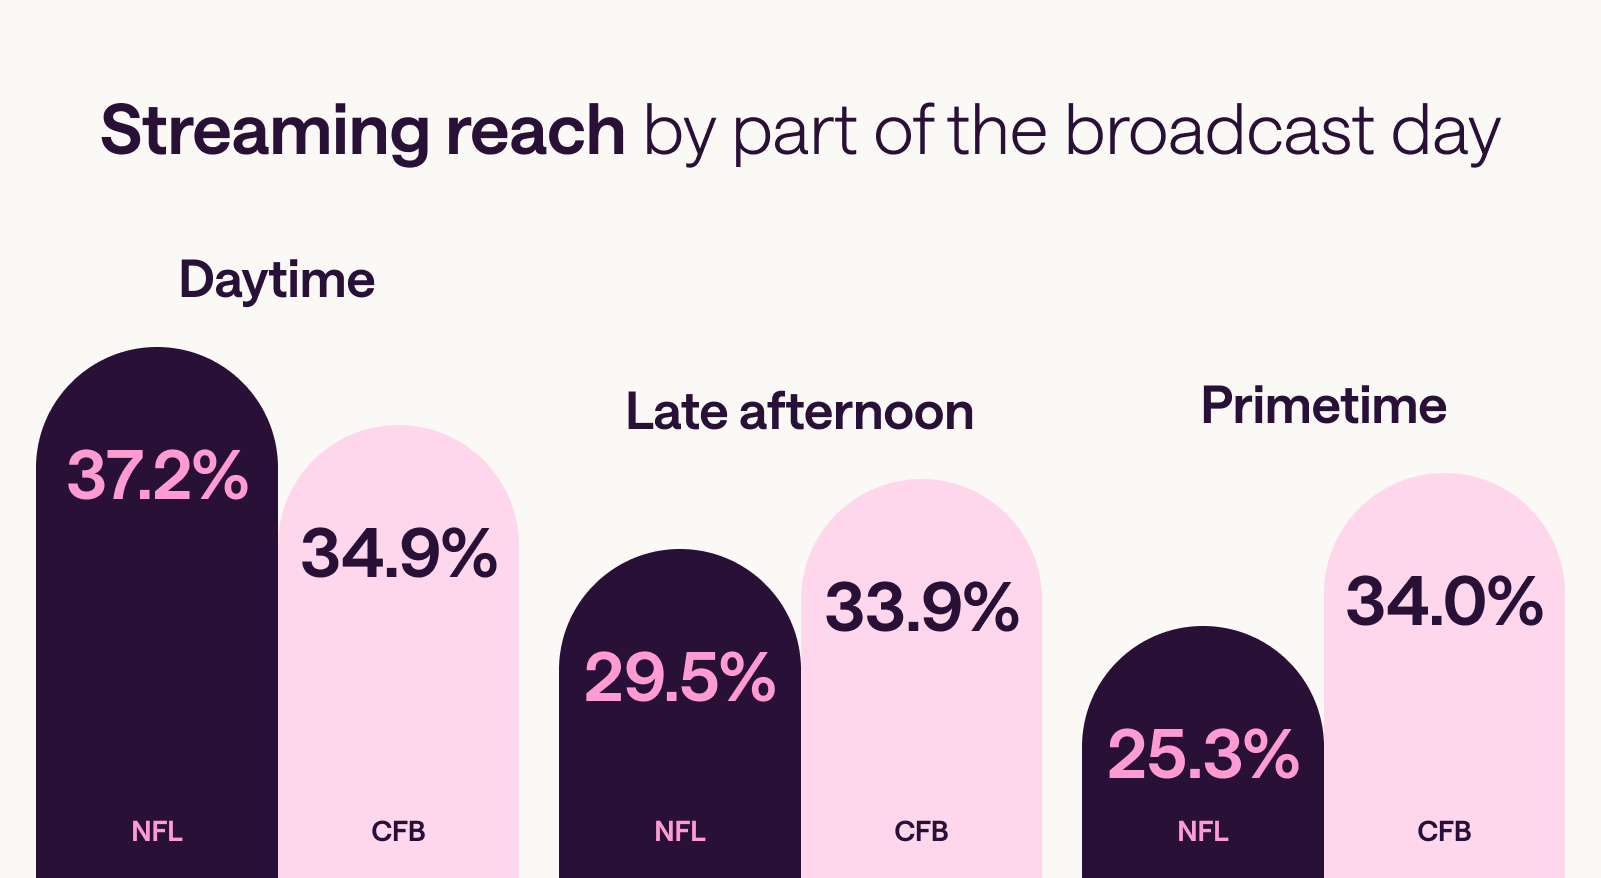
The clock matters, too. NFL streaming drops 12 points from daytime to primetime. College football barely moves, holding around 34% all day.
College football is powered by local fandom
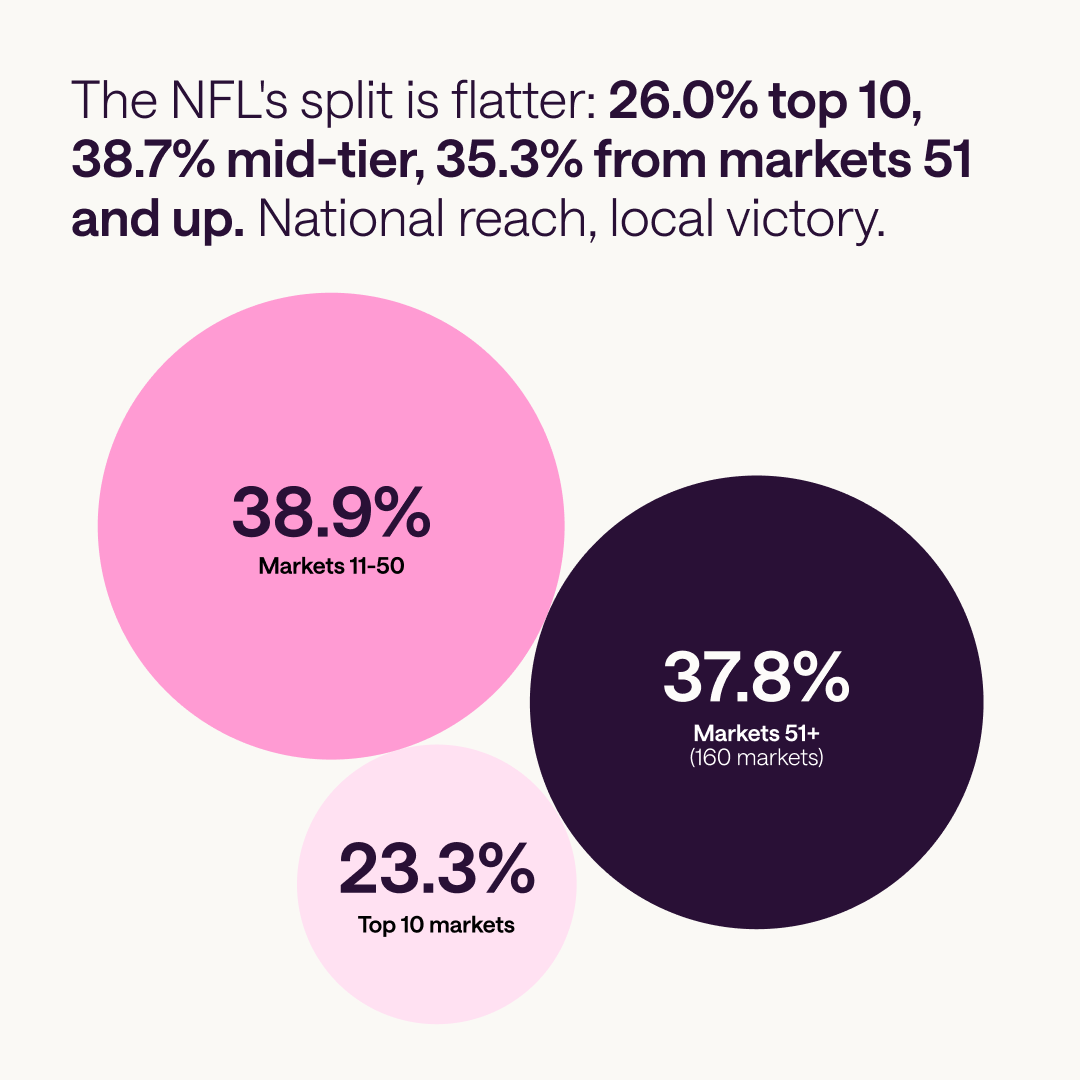
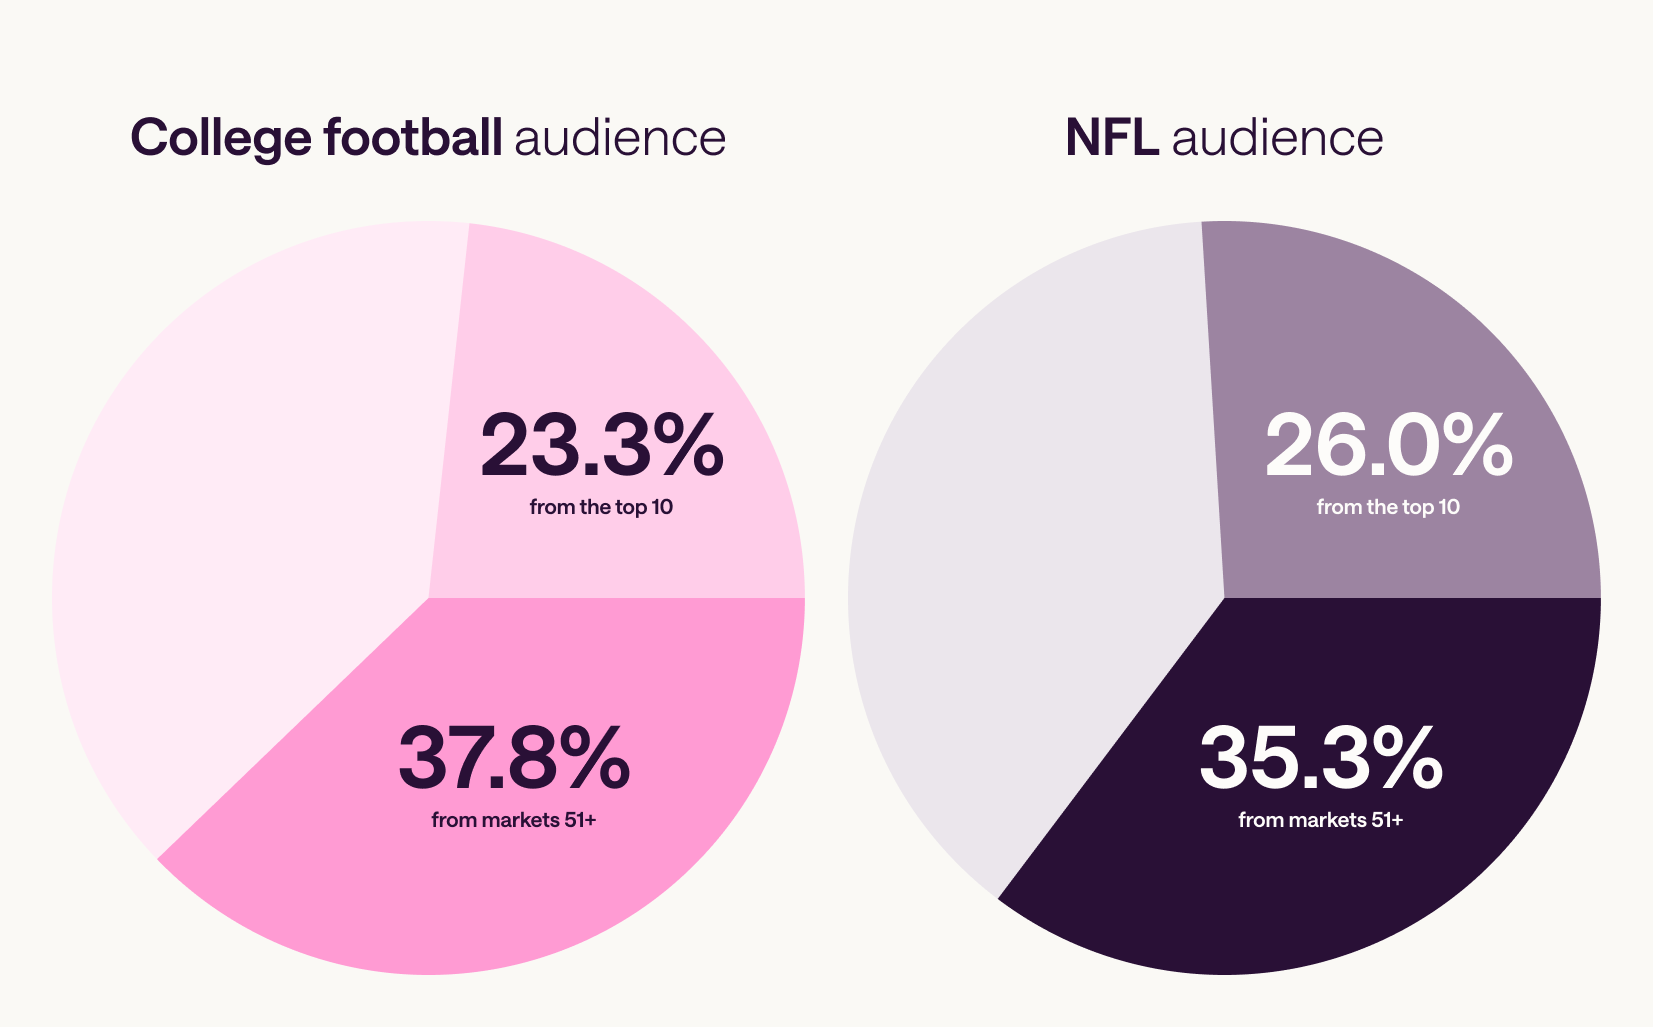
College football skews toward smaller markets, which deliver 37.8% of its audience versus 23.3% from the top 10. The NFL is more balanced: 26% from the top 10 and 35.3% from markets 51+.
Hometown pride amplifies viewership: college teams’ home markets watch at 4.3x the national rate, versus 2.45x for the NFL.
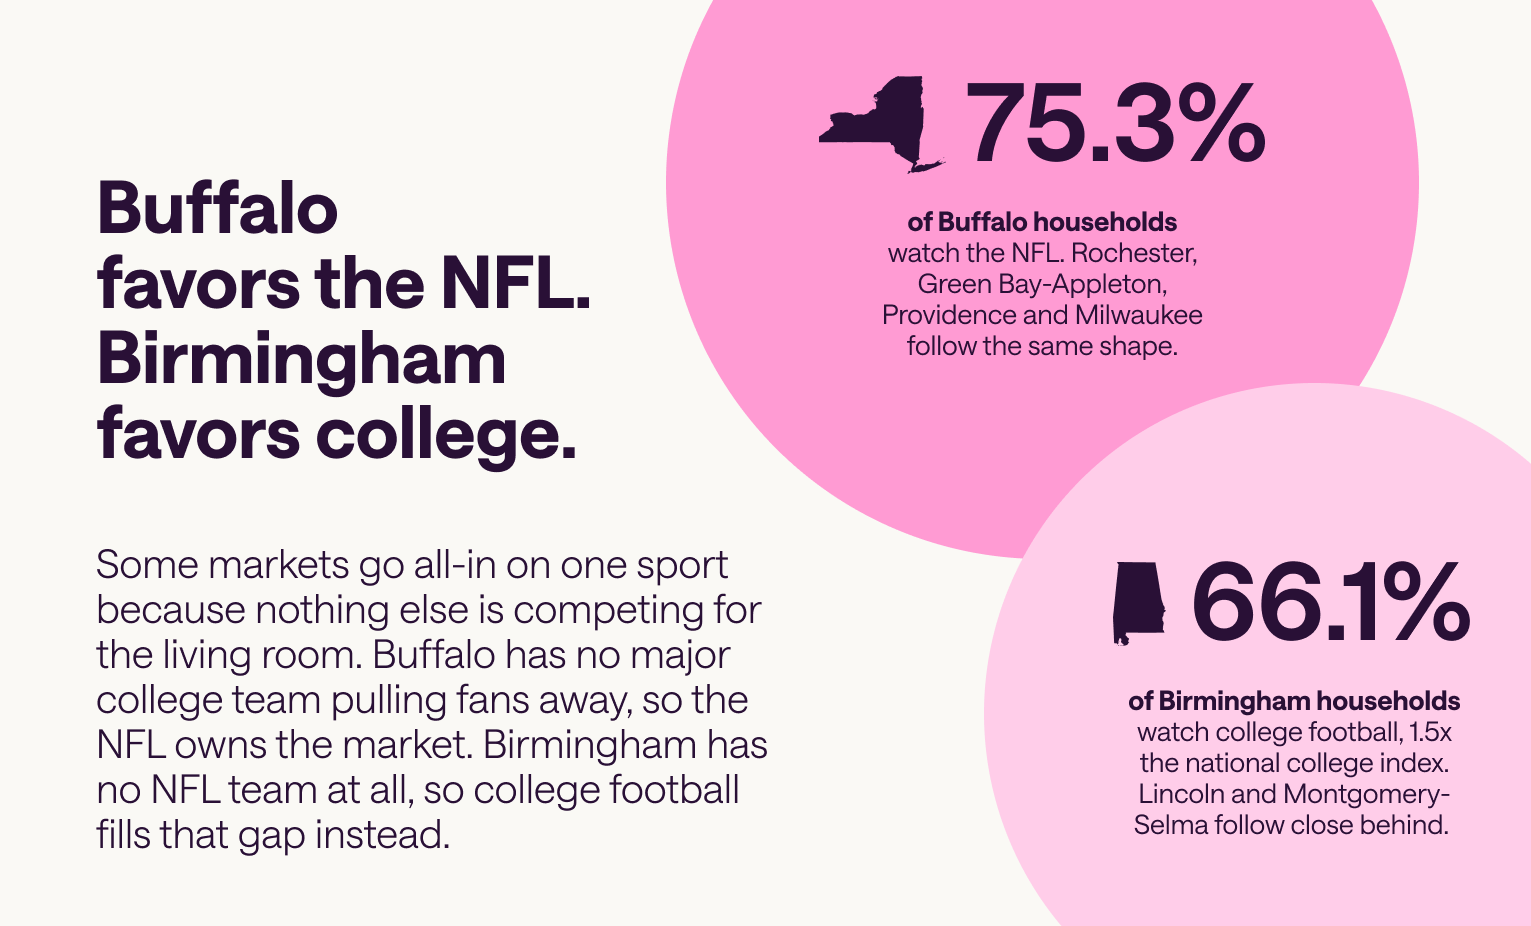
Buffalo favors the NFL. Birmingham favors college football.
Home teams drive spikes game by game. When Oklahoma played Toledo during primetime on September 6, 2025, viewing jumped 3.6x in Oklahoma City and 3.2x in Tulsa.
Small markets show up every week
Big city consumers are often more casual sports fans. In the top 10 markets, 32.5% of college football viewers (and 25.5% of NFL viewers) watched only one week all season. In small markets, fans show up nearly every week.
The takeaway: if you want viewers to really get to know your brand, stay with them longer in smaller markets.
The time your ad airs changes who sees it
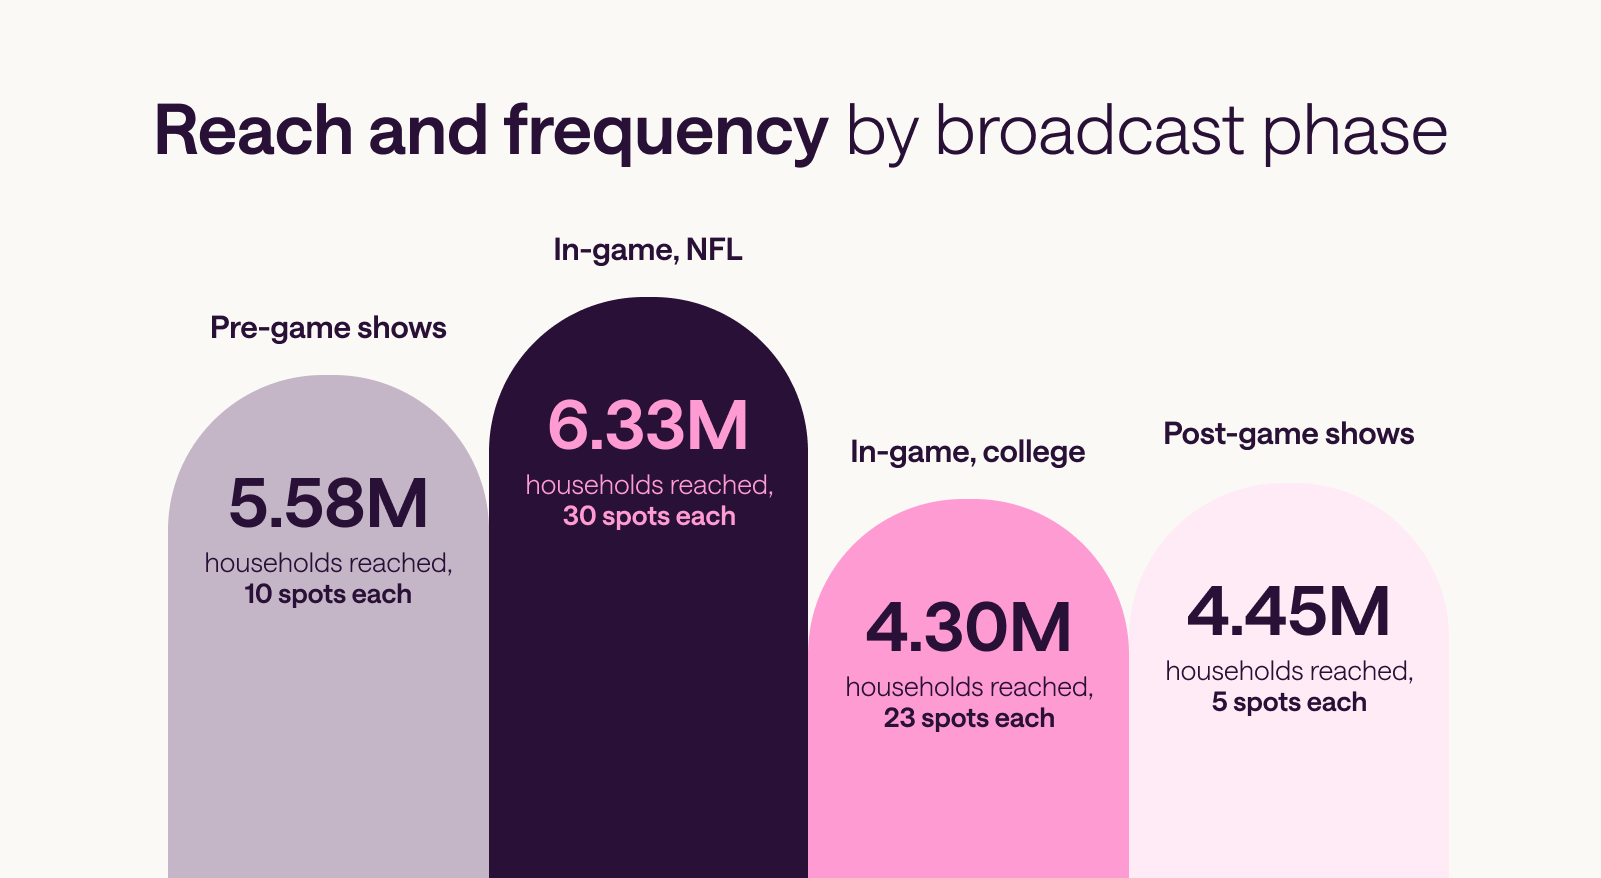
Timing shapes impact. Pre-game shows reached 5.58M households at about 10 ads each, post-game reached 4.45M at 5 each, and live NFL games reached 6.33M at about 30 each.
For cost-effective new reach, buy post-game. For repetition that sticks, buy in-game. And look beyond kickoff: NFL ad reach triples in the half hour before games, then peaks 90 minutes in, 35% above kickoff levels.
The bigger the game, the longer they stay
High stakes hold attention. 98% of Super Bowl and playoff ad breaks are watched in full. Close games keep 90.6% of peak audience through the final 20 minutes, versus 72.4% for blowouts, so shift weight toward tight games in-flight.
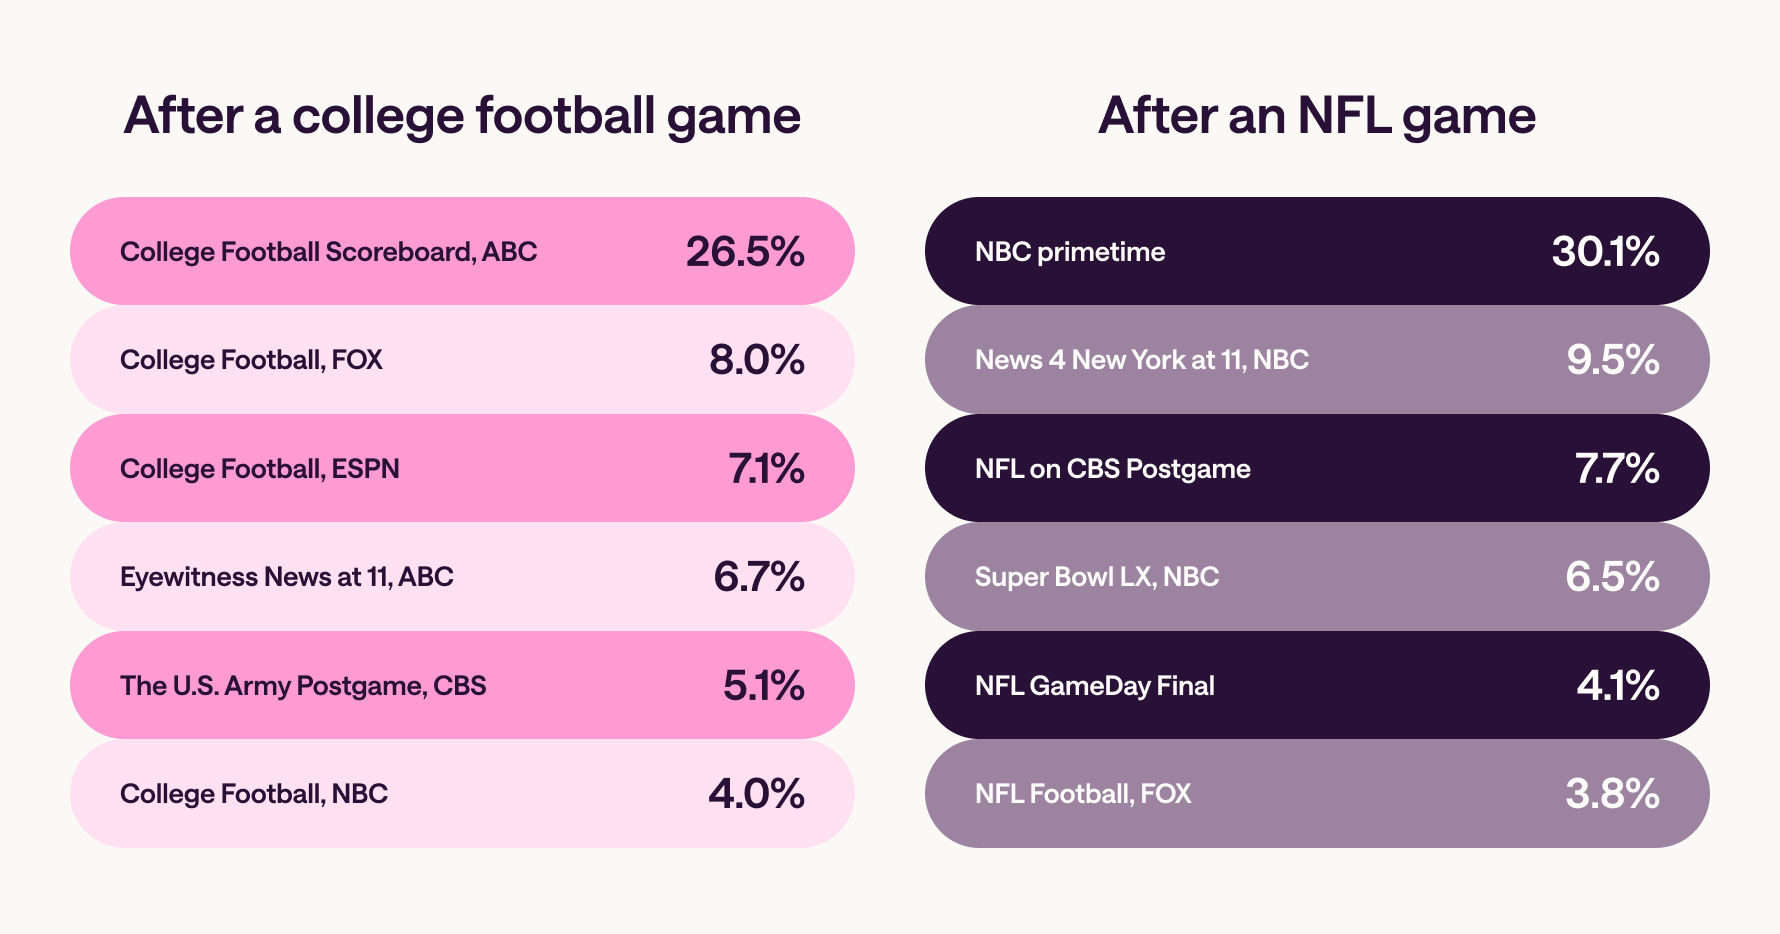
Post-game behavior varies by night. After NFL primetime, 60.5% of households leave within the hour. After Saturday daytime games, just 10.7% leave, and most keep watching for 2.5+ hours.
Winning the home field
A full season of data tells one consistent story. Football’s real value is local. It shows up in Birmingham on a Saturday, in Buffalo on a Sunday, and on Super Bowl night, when households that skipped the entire season finally tune in. For anyone planning around football this fall, the lesson is simple: the game looks different in every market, and the plan should too.
Acting on that takes local intelligence that can see a single market as clearly as the whole country. That’s why we built Maverick AI, to help local advertisers turn household-level viewing data into an executable local plan.